Climate Change Is Accelerating — And So Are the Solutions
# Climate Change is Accelerating — And So Are the Solutions
Pillar : Energy & Climate | Format : In-depth article | Date : March 20, 2026
---
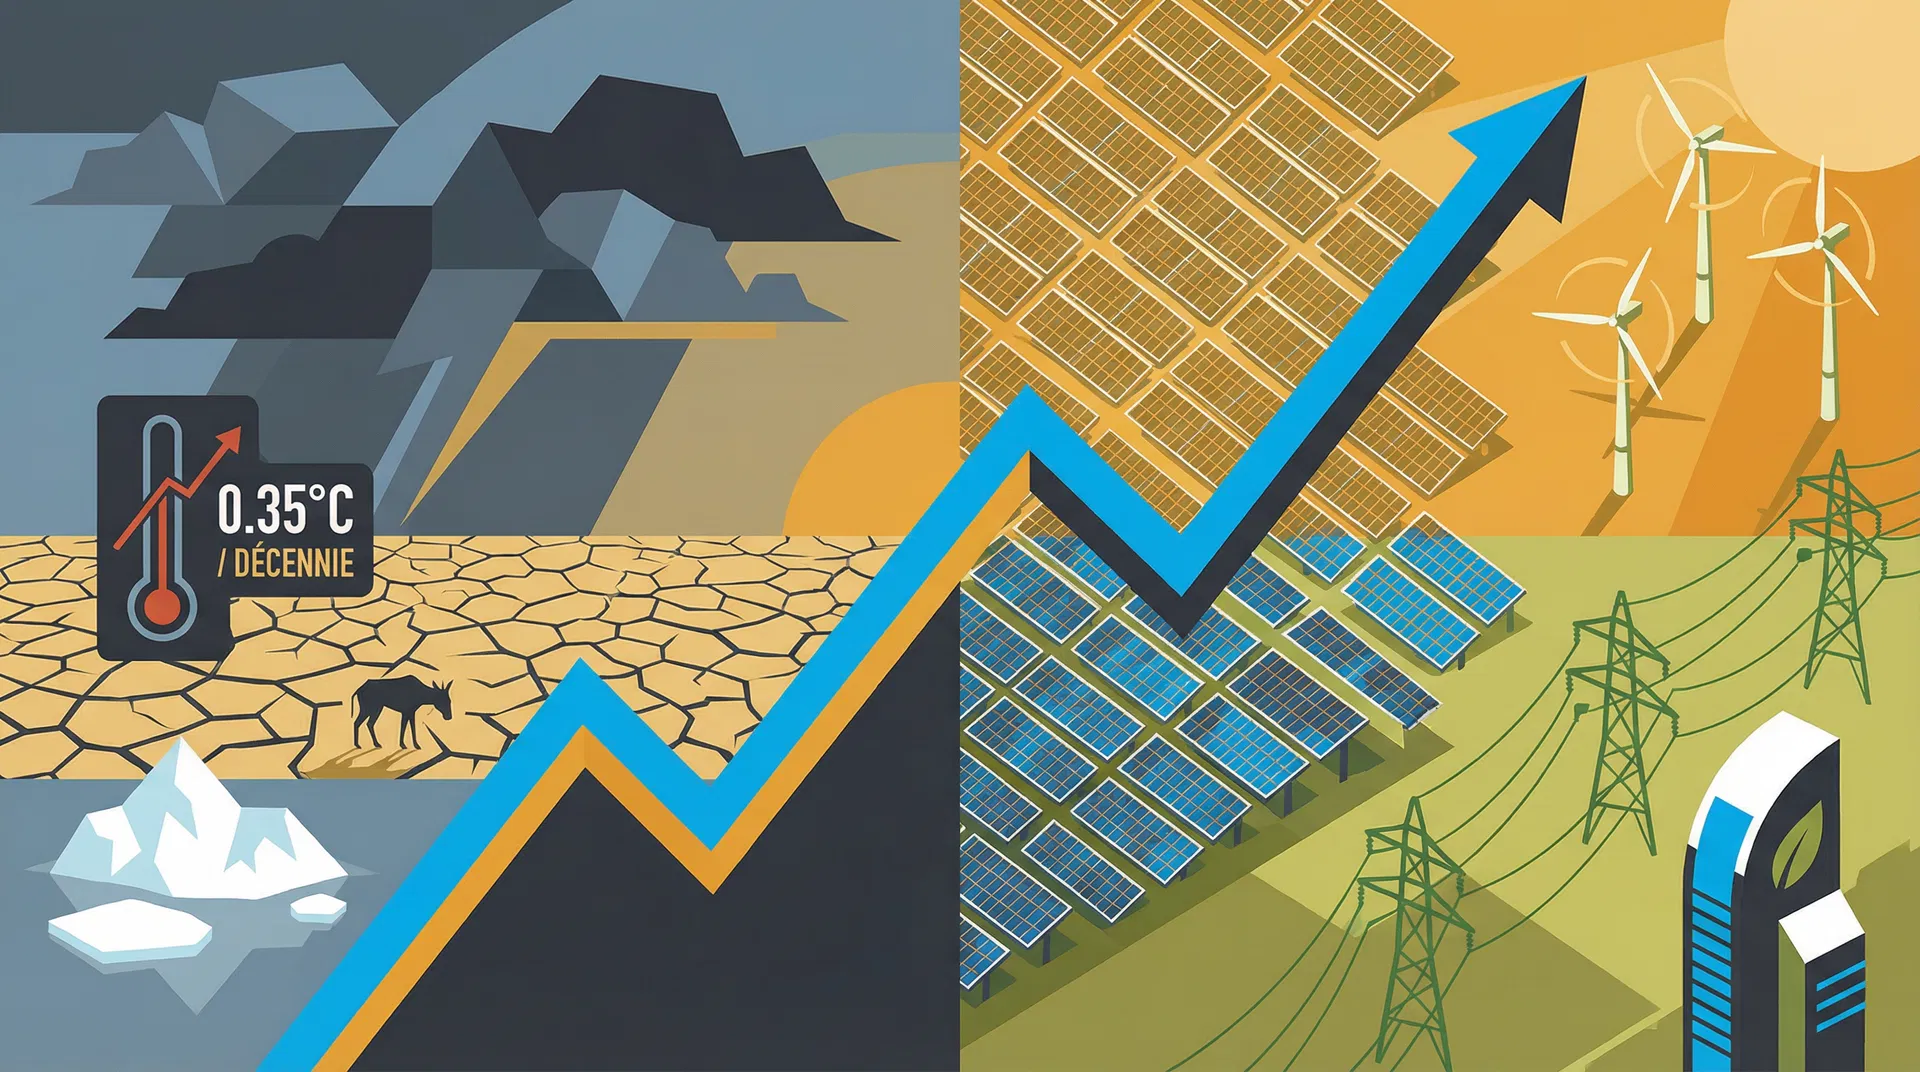
The Earth is now warming at a rate of 0.35 °C per decade — nearly double the rate measured in the 1970s. This is the conclusion of a study published on March 6, 2026, in Geophysical Research Letters by statistician Grant Foster and climatologist Stefan Rahmstorf, from the Potsdam Institute for Climate Impact Research. Their analysis, based on five of the most widely used global temperature datasets, including NASA's, provides what the authors describe as the strongest statistical evidence to date that warming is not merely continuing — it is accelerating.
But the acceleration of warming tells only half the story. The other half, less publicized but just as real, is the acceleration of solutions: the plummeting costs of renewable energies, the rapid progress of solar and wind power, adaptation policies that work, and carbon capture technologies emerging from the laboratory. Understanding both dynamics simultaneously — the crisis and the responses — is essential for an honest analysis.
0.35 °C Per Decade: Doubling Confirmed by Five Datasets
For decades, the global warming rate fluctuated around 0.18 to 0.20 °C per decade. Since the mid-2010s, this rate has significantly increased. The study by Foster and Rahmstorf estimates that it now reaches 0.35 °C per decade — a 75% increase compared to previous estimates. Other researchers, such as Zeke Hausfather of Berkeley Earth, place the current rate at approximately 0.30 °C per decade, a slightly lower range but one that confirms the same trend.
This is not a statistical artifact linked to the record heat of 2023 and 2024. The methodological originality of the study lies precisely in its treatment of natural factors: Foster and Rahmstorf subtracted the effect of the powerful El Niño episode that contributed to the record temperatures of these two years. Even after this correction, the acceleration remains visible. The analysis also incorporates the effect of volcanic eruptions, which temporarily cool the atmosphere by injecting aerosols into the stratosphere.
| Period | Estimated Warming Rate |
|---|---|
| 1970s | ~0.18-0.20 °C/decade |
| 1990s-2000s | ~0.20-0.22 °C/decade |
| 2015-2026 (Foster & Rahmstorf) | ~0.35 °C/decade |
| 2015-2026 (Berkeley Earth) | ~0.30 °C/decade |
The Primary Cause: Shipping
The acceleration is not solely due to the increase in CO₂ emissions. A specific cause, identified by several research teams since 2023, plays a central role: the reduction of sulfur emissions by international maritime transport.
In 2020, the International Maritime Organization (IMO) imposed a strict limit on the sulfur content of marine fuels, reducing it from 3.5% to 0.5%. This regulation, adopted for public health reasons — sulfur dioxide (SO₂) emissions cause respiratory and cardiovascular diseases — had an unexpected secondary effect on the climate. Sulfur particles emitted by ships formed low-altitude clouds over the oceans, which reflected some solar radiation back into space and slightly cooled the Earth's surface. By reducing these emissions, the regulation removed this involuntary "shield."
The effect is quantifiable. Studies published in 2024 and 2025 estimate that the reduction in marine sulfate aerosols contributed an additional positive radiative forcing of about 0.1 to 0.2 W/m² — a significant disturbance at the scale of the climate system. This is one of the rare times in recent history where an environmental measure beneficial to human health has had a short-term warming effect on the global climate.
Between 0.30 and 0.35 °C: Debating the Numbers, Agreeing on the Trend
The Foster and Rahmstorf study does not find universal agreement on the exact rate. Robert Rohde, scientific director at Berkeley Earth, believes that the methods used to subtract natural fluctuations "are imperfect and leave some residual effects." He prefers an estimate of 0.30 °C per decade. This divergence is not trivial: a 0.05 °C difference in the decadal rate represents a substantial difference in 20 or 30-year projections.
But Rohde and Hausfather agree on the essential point: warming is accelerating. The range of serious estimates lies between 0.27 and 0.35 °C per decade. The consensus is clear: the acceleration is real, its exact magnitude remains under discussion.
Solar Costs Have Plummeted 90% in Ten Years — Now Covering 40% of Global Electricity
This is where the analysis must be complemented. The acceleration of warming is occurring simultaneously with an unprecedented acceleration in the deployment of renewable energies — and the data are just as robust.
In 2025, solar photovoltaic power represented the leading source of added electricity worldwide for the third consecutive year. Installed solar capacity exceeded 3,000 GW — more than the total capacity of coal, gas, and nuclear combined. The cost of solar PV plummeted by 90% in ten years, and by an additional 15% in 2025. Renewables covered 40% of global electricity demand in 2025, up from 30% in 2020 (IEA, Electricity 2026).
This progress is not marginal. In 2025, newly installed renewable capacities worldwide avoided the emission of approximately 2.5 billion tonnes of CO₂ compared to a scenario where these needs would have been covered by gas-fired power plants. This is equivalent to the entire European Union's annual emissions.
Industrial policies have played a decisive role. The American Inflation Reduction Act (IRA, 2022) triggered $300 billion in private investments in clean energy in the United States over three years. The European Green Deal led to a threefold increase in European offshore wind capacities between 2020 and 2025. China, which accounts for 60% of new global renewable capacities, deployed more solar capacity in 2025 than the rest of the world combined in 2022.
80% Reduction in Mortality: Early Warning Systems Transform Heatwave Response
Beyond emission reductions, ongoing warming adaptation policies are showing documented results.
Early warning systems for heatwaves have transformed the public health response in Europe since the 2003 heatwave, which killed 70,000 people. In 2023, a heatwave of comparable intensity in Europe caused approximately 15,000 deaths — still tragic, but an 80% reduction compared to 2003, attributed to heatwave plans, air conditioning in healthcare facilities, and alert systems. France, which developed Europe's most sophisticated heatwave plan after 2003, reduced its heat-related mortality by 60% compared to projections without adaptation.
Cities are also adapting. Medellín (Colombia) reduced temperatures in some neighborhoods by 3 to 4 °C through "green corridors" — rows of trees planted along traffic arteries. Singapore has developed a network of connected parks and green roofs that reduces the urban heat island effect. Rotterdam has transformed its stormwater management infrastructure to absorb extreme rainfall linked to climate change, becoming a global reference in urban adaptation.
Carbon capture technologies are gradually emerging from the laboratory. In 2025, global Direct Air Capture (DAC) capacity reached 1 million tonnes of CO₂ per year — still marginal compared to the 37 billion tonnes emitted annually, but growing by 300% compared to 2022. The cost of DAC decreased from $1,000 per tonne in 2020 to approximately $400 in 2025; industry projections aim for $100 to $150 per tonne by 2035.
The Arctic is Warming Four Times Faster: Feedbacks Amplifying the Crisis
Beyond the immediate identified causes — reduction of marine aerosols, increase in CO₂ concentrations — the acceleration of warming can be amplified by climate feedbacks. These are mechanisms by which initial warming triggers changes that, in turn, amplify further warming.
The most documented feedback is that of Arctic ice. Arctic sea ice reflects a large portion of solar radiation back into space (high albedo). When it melts, it is replaced by dark seawater, which absorbs more heat (low albedo). This mechanism amplifies warming in polar regions — a phenomenon known as Arctic amplification. The Arctic is warming approximately four times faster than the global average.
These feedbacks reinforce the urgency of rapid action on emissions — precisely because solutions exist and are deployable at a large scale. The window to avoid the most severe feedbacks is not closed, but it is narrowing.
What This Changes — And What It Doesn't
The acceleration of warming does not mean that climate models were wrong. On the contrary, IPCC projections had anticipated an acceleration linked to aerosol reduction. What is new is the empirical confirmation that this acceleration is already underway.
What this changes is the urgency of adaptation decisions. Infrastructures designed for 2 °C warming by 2100 must be recalibrated if the current rate persists. Projections for sea level rise, heatwave frequency, water stress, and cyclone intensification are all sensitive to the decadal warming rate.
What this does not change is the fundamental physics: CO₂ emissions remain the primary cause of long-term warming. And the solutions — renewables, energy efficiency, adaptation, carbon capture — are available, increasingly competitive, and already deployed at a large scale. The trajectory is not fixed. It depends on decisions made in the coming years.
0.35 °C Warming, 40% Renewable Electricity: The Decade of Two Accelerations
The Foster and Rahmstorf study will likely be challenged, refined, and complemented in the coming months. This is the normal functioning of science. What is less likely to be called into question is the underlying trend: the last three years have been the warmest on record, and surface temperature data show an acceleration consistent with the identified mechanisms.
But the underlying trend on the solutions side is just as real: the cost of solar has plummeted by 90% in ten years, renewables cover 40% of global electricity demand, and adaptation policies are showing measurable results. Warming is accelerating — and so are the responses. This is the central tension of the climate decade.
---
Sources
1. Foster, G. & Rahmstorf, S. (2026). Geophysical Research Letters, 53, e2025GLI18804. https://agupubs.onlinelibrary.wiley.com/doi/10.1029/2025GL118804
2. Witze, A. (2026, March 6). "Climate change is speeding up — the pace nearly doubled in ten years." Nature, 651, 569-570. https://www.nature.com/articles/d41586-026-00745-z
3. IEA (2026, March 18). Electricity 2026 — Executive Summary. https://www.iea.org/reports/electricity-2026/executive-summary
4. Forster, P. M. et al. (2025). Earth System Science Data, 17, 2641–2680. https://essd.copernicus.org/articles/17/2641/2025/
5. Copernicus Climate Change Service (2026). European State of the Climate 2025. https://climate.copernicus.eu/esotc/2025
6. BloombergNEF (2026). New Energy Outlook 2026. https://about.bnef.com/new-energy-outlook/